Conran Design
Interactive data visualisation
- Client
- Conran Design
- Sector
- Design & Branding
- Project
- Interactive data visualisation
Project summary
Conran Design Group needed two interactive data visualisations for an existing client website, transforming complex global datasets into intuitive, explorable experiences. I developed the front-end functionality for both solutions, combining interactive mapping, dynamic data and responsive user controls within the client's existing website.
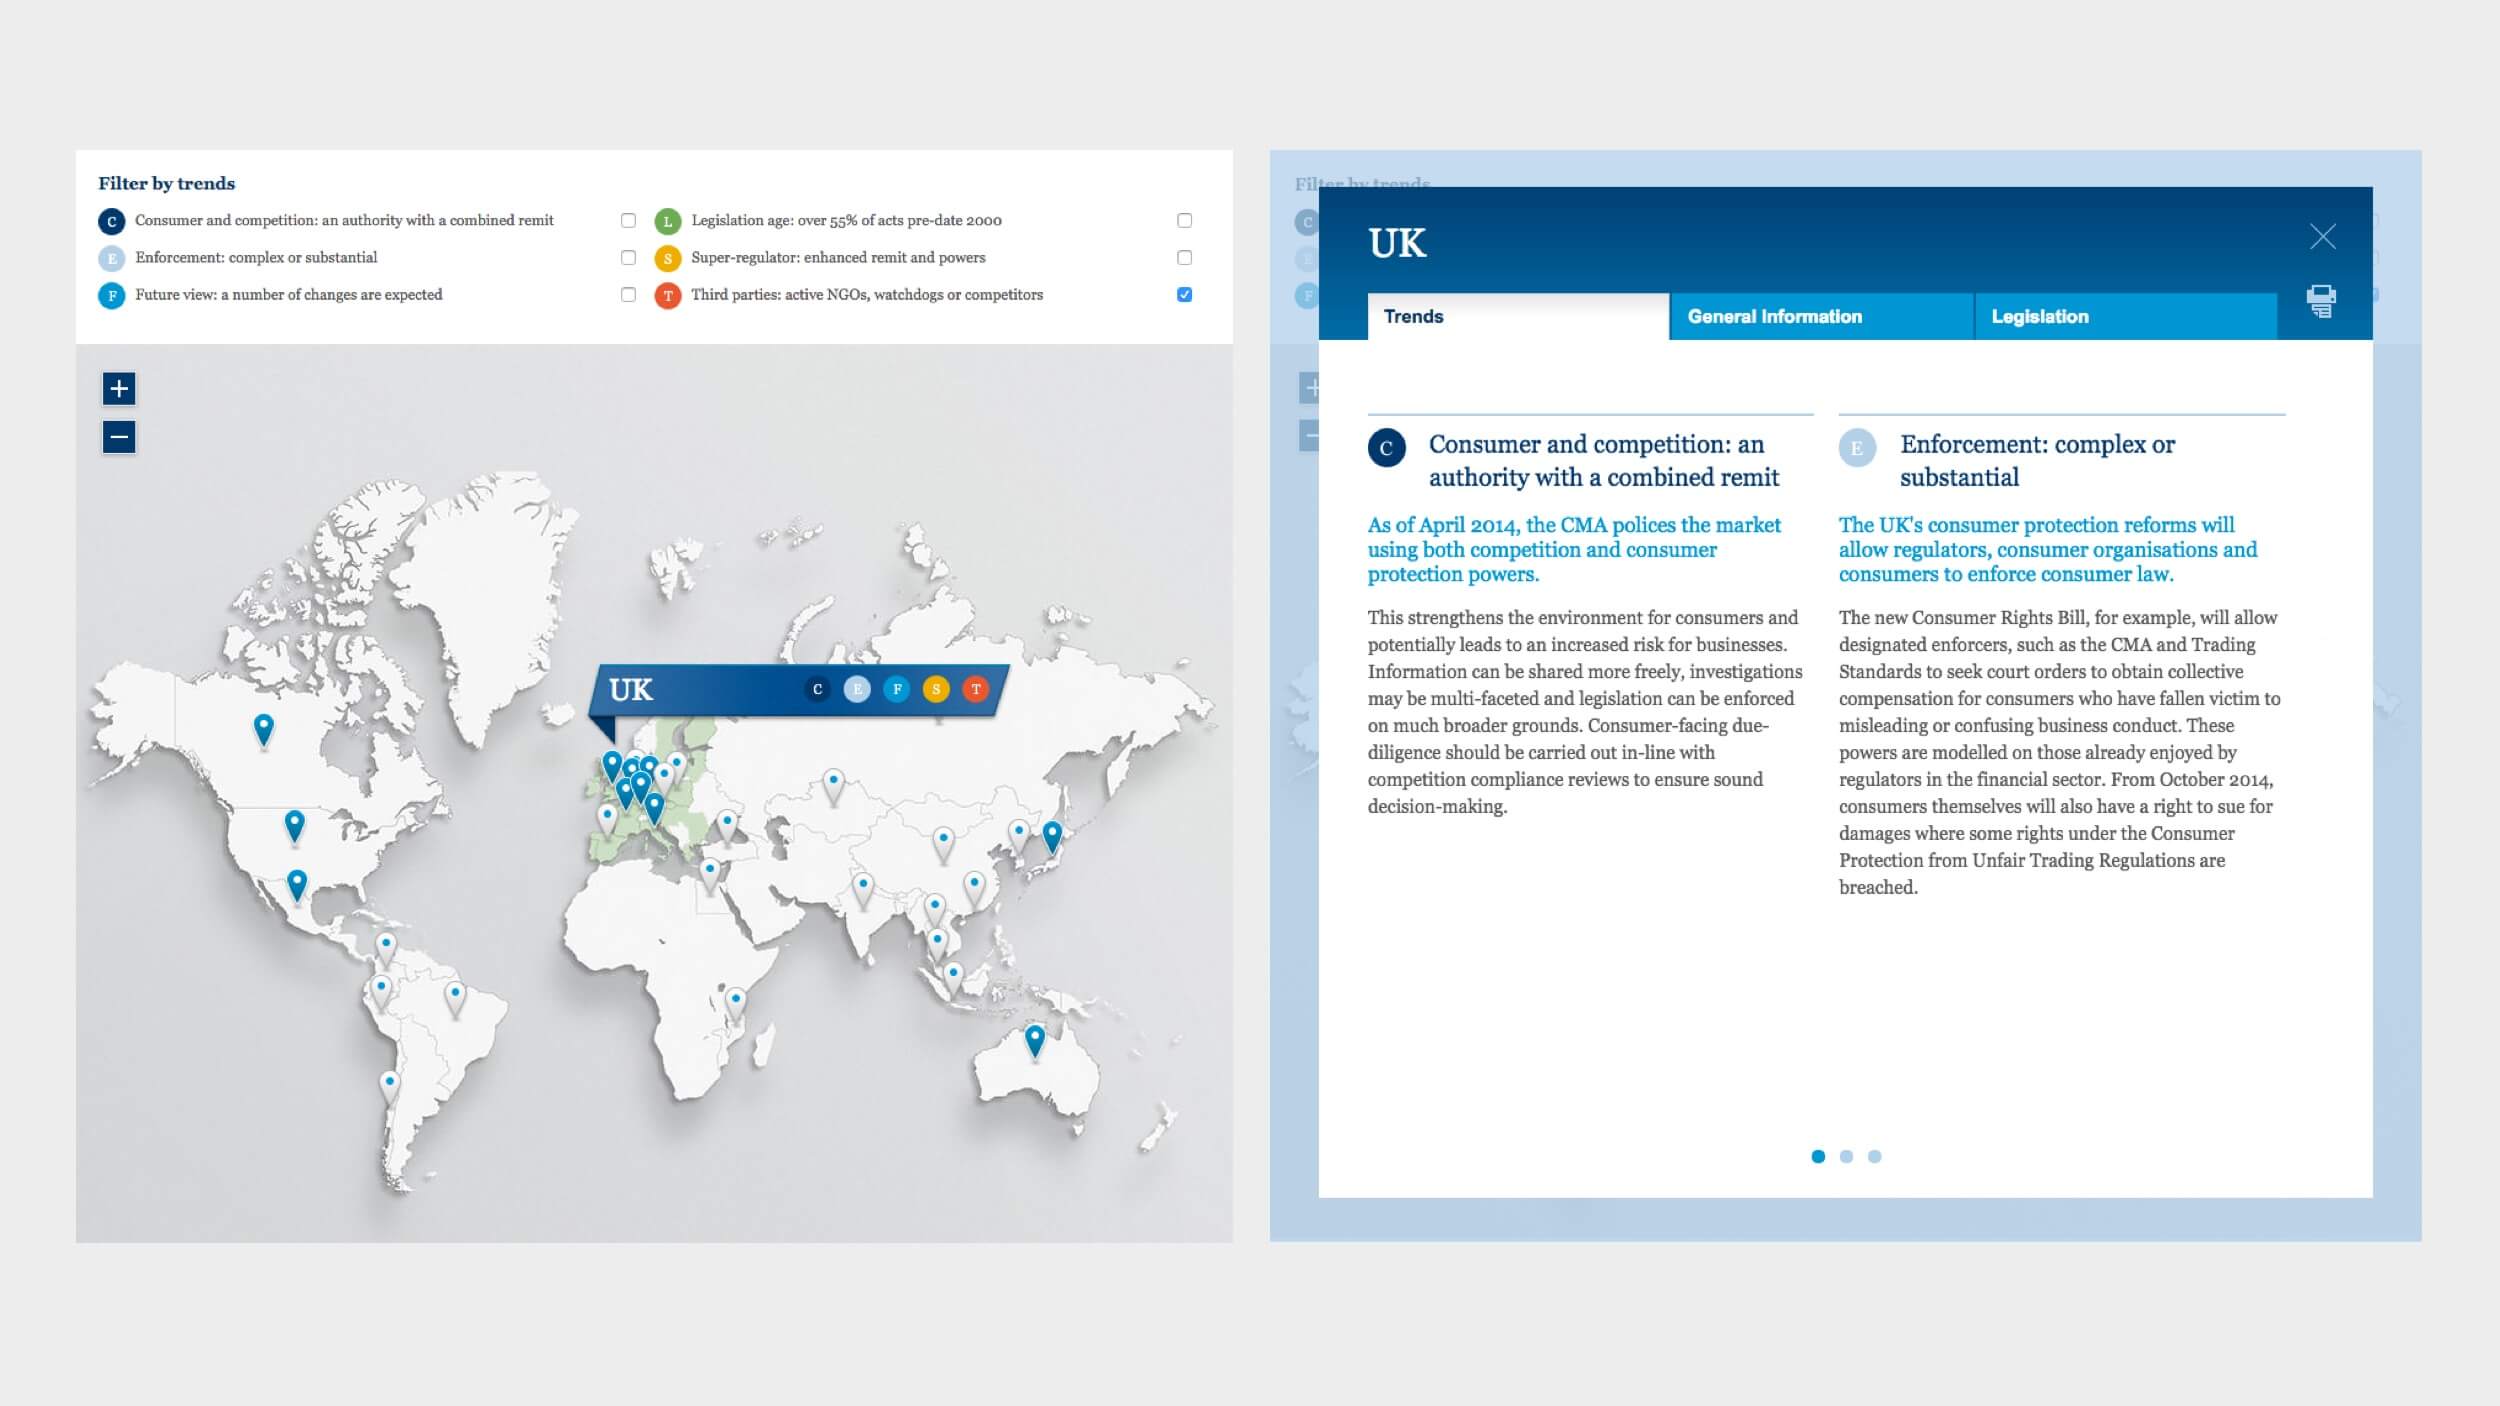
The Regulatory Map
The Regulatory Map transformed regulatory data from 30 global markets into an interactive world map.
Users could explore individual countries, compare markets and filter the data by activity. Selecting a country dynamically loaded the relevant regulatory content without requiring the page to reload.
The interface used colour-coded ratings to make differences between markets immediately visible, while providing access to more detailed information when required.
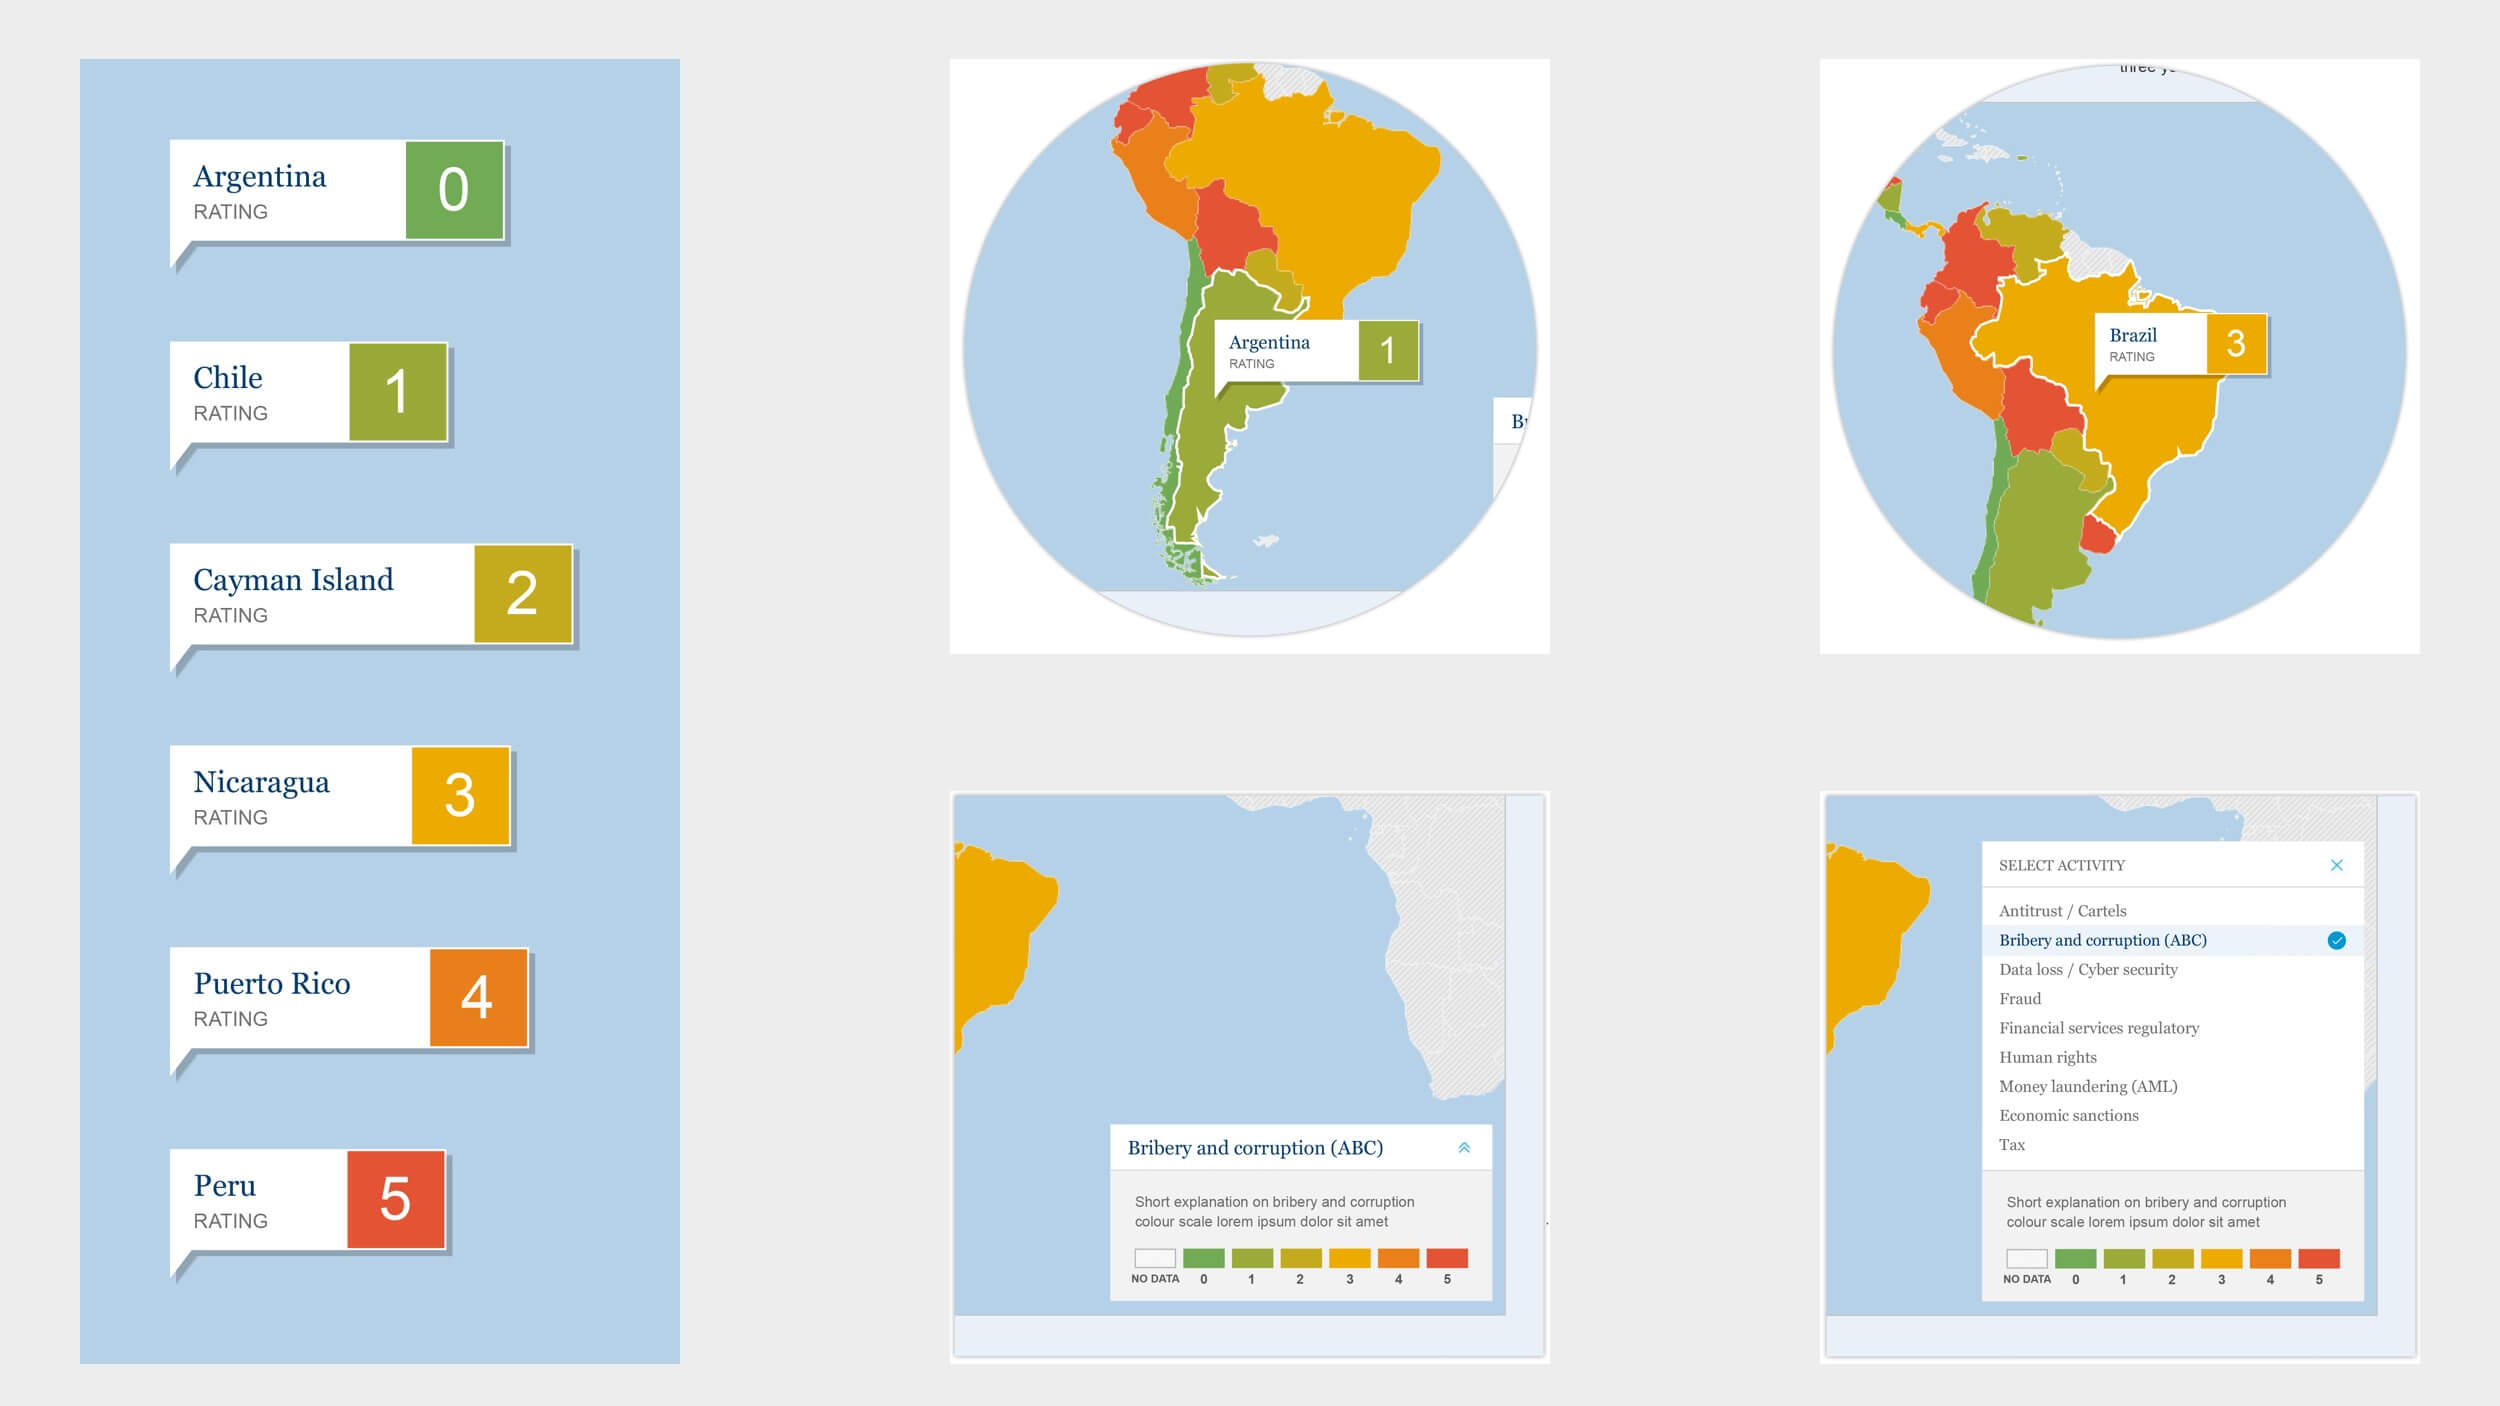
The Heatmap
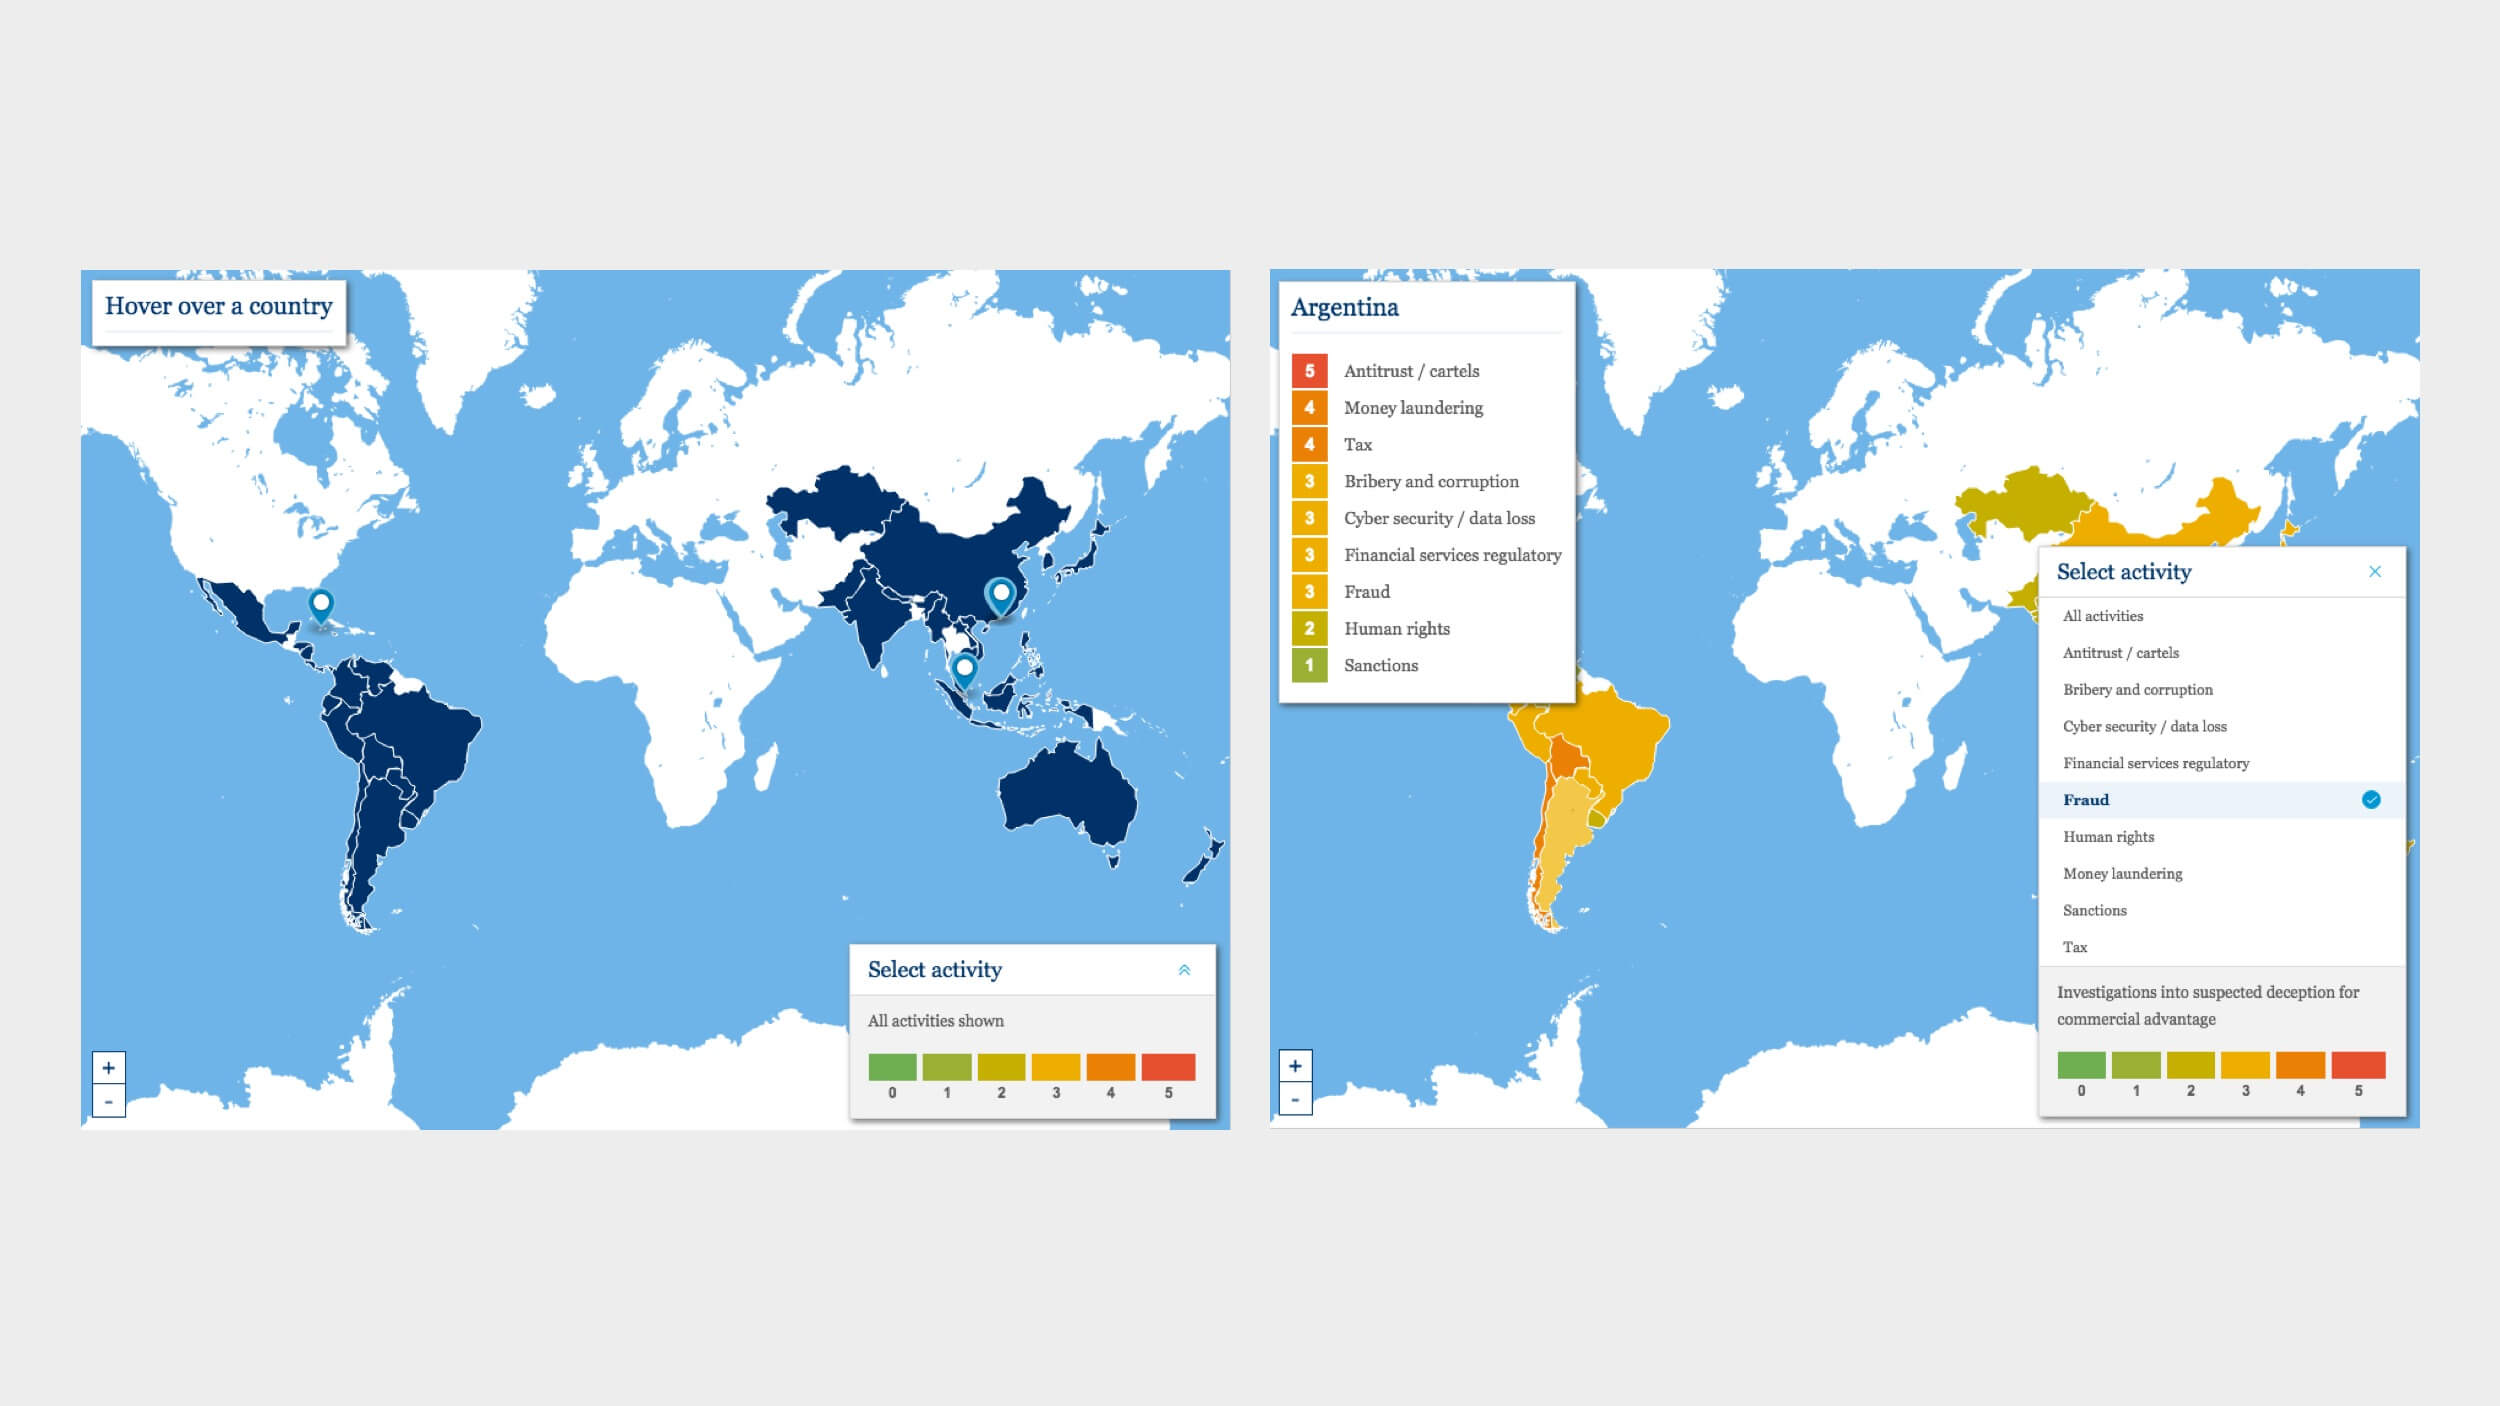
The second visualisation used an external mapping platform with custom interactive overlays based on GeoJSON data.
Users could filter the map by activity and explore individual markets, with contextual information displayed dynamically for each selected region.
The result turned a complex international dataset into a visual interface that allowed users to move quickly from a global overview to detailed country-level information.